

Amounts follow the selected report measure. Imported order totals include the amounts supplied by each store; they are not net revenue or collected payments. Missing amounts stay unknown. Stores and native currencies are kept separate. See How order numbers work for the trust marks used on this page.
Key metrics
The pace tile is honest about when it cannot project: Available after 5 completed days., Complete daily history is needed for a projection., Complete daily amounts are needed for a projection. or This period has ended.
Sales per day
The Sales per day chart draws one line per store, in its own currency. Days without confirmed history show as unknown, never as zero, so a gap in the line is a gap in the import, not a day with no sales. Use Show exact daily values for the table behind the chart. With Compare on, the chart adds Compared with the previous period with This period, Previous period, Difference and Change (%). Today is still running, so a fair comparison stops at yesterday; pick a period that ends yesterday to compare.Breakdowns
Four breakdowns sit below the chart:Explore sales
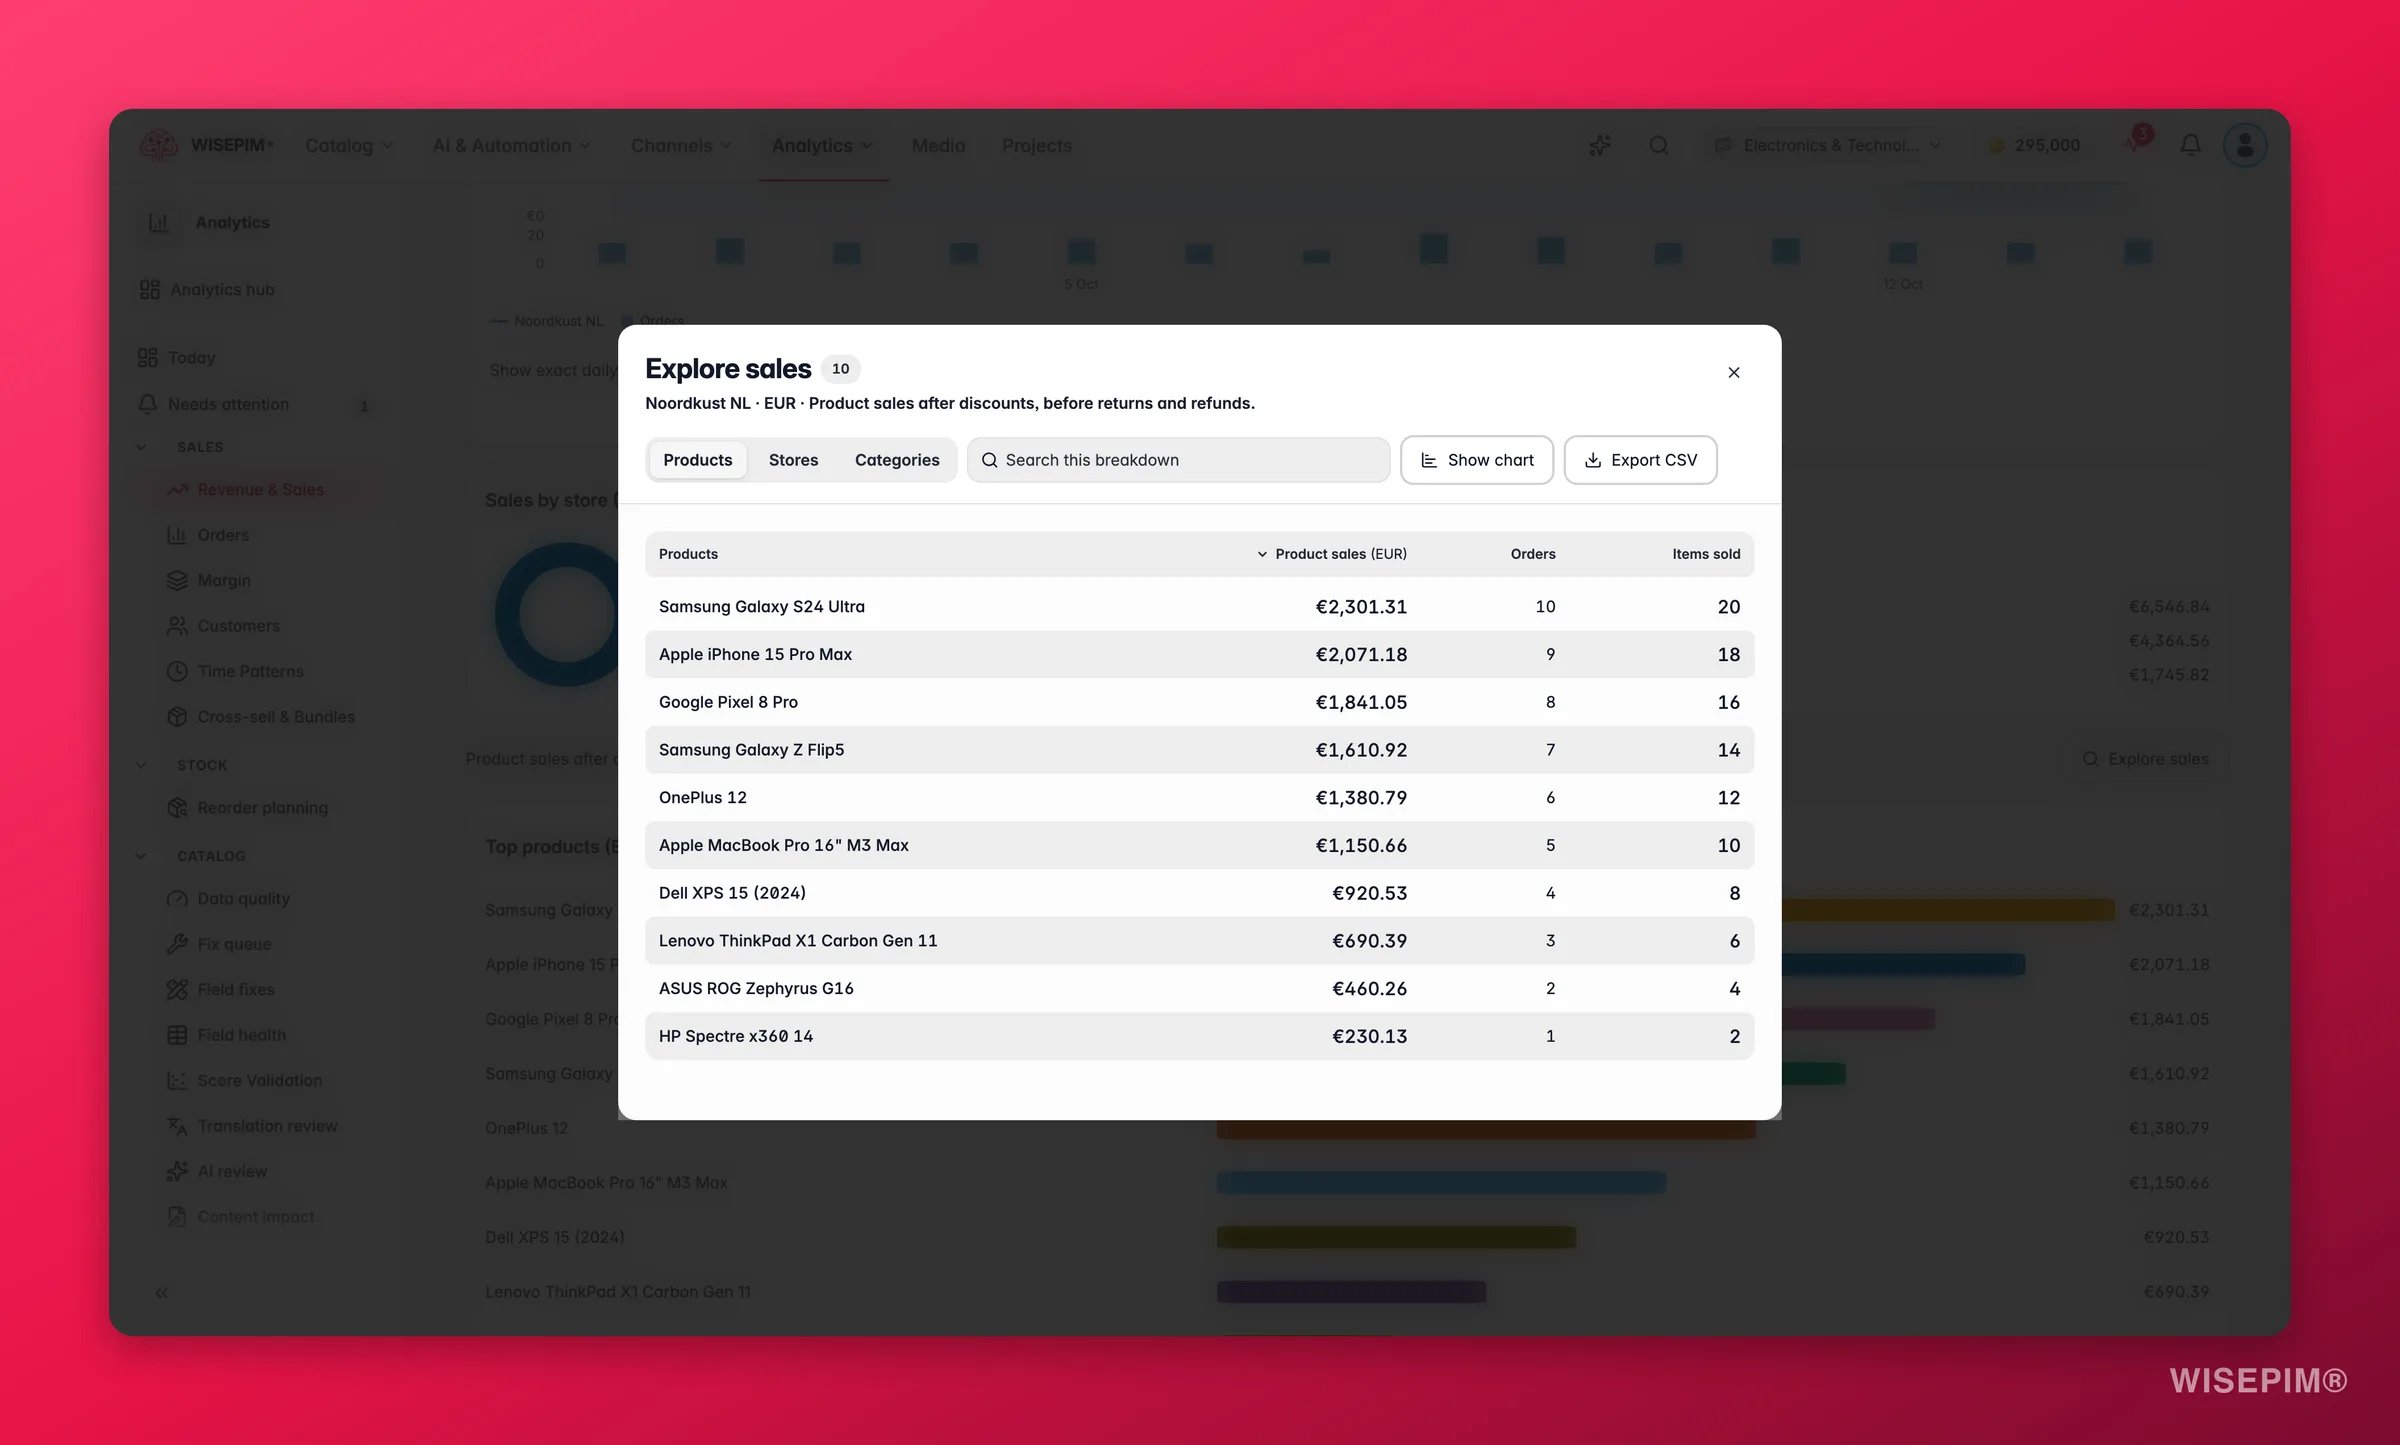
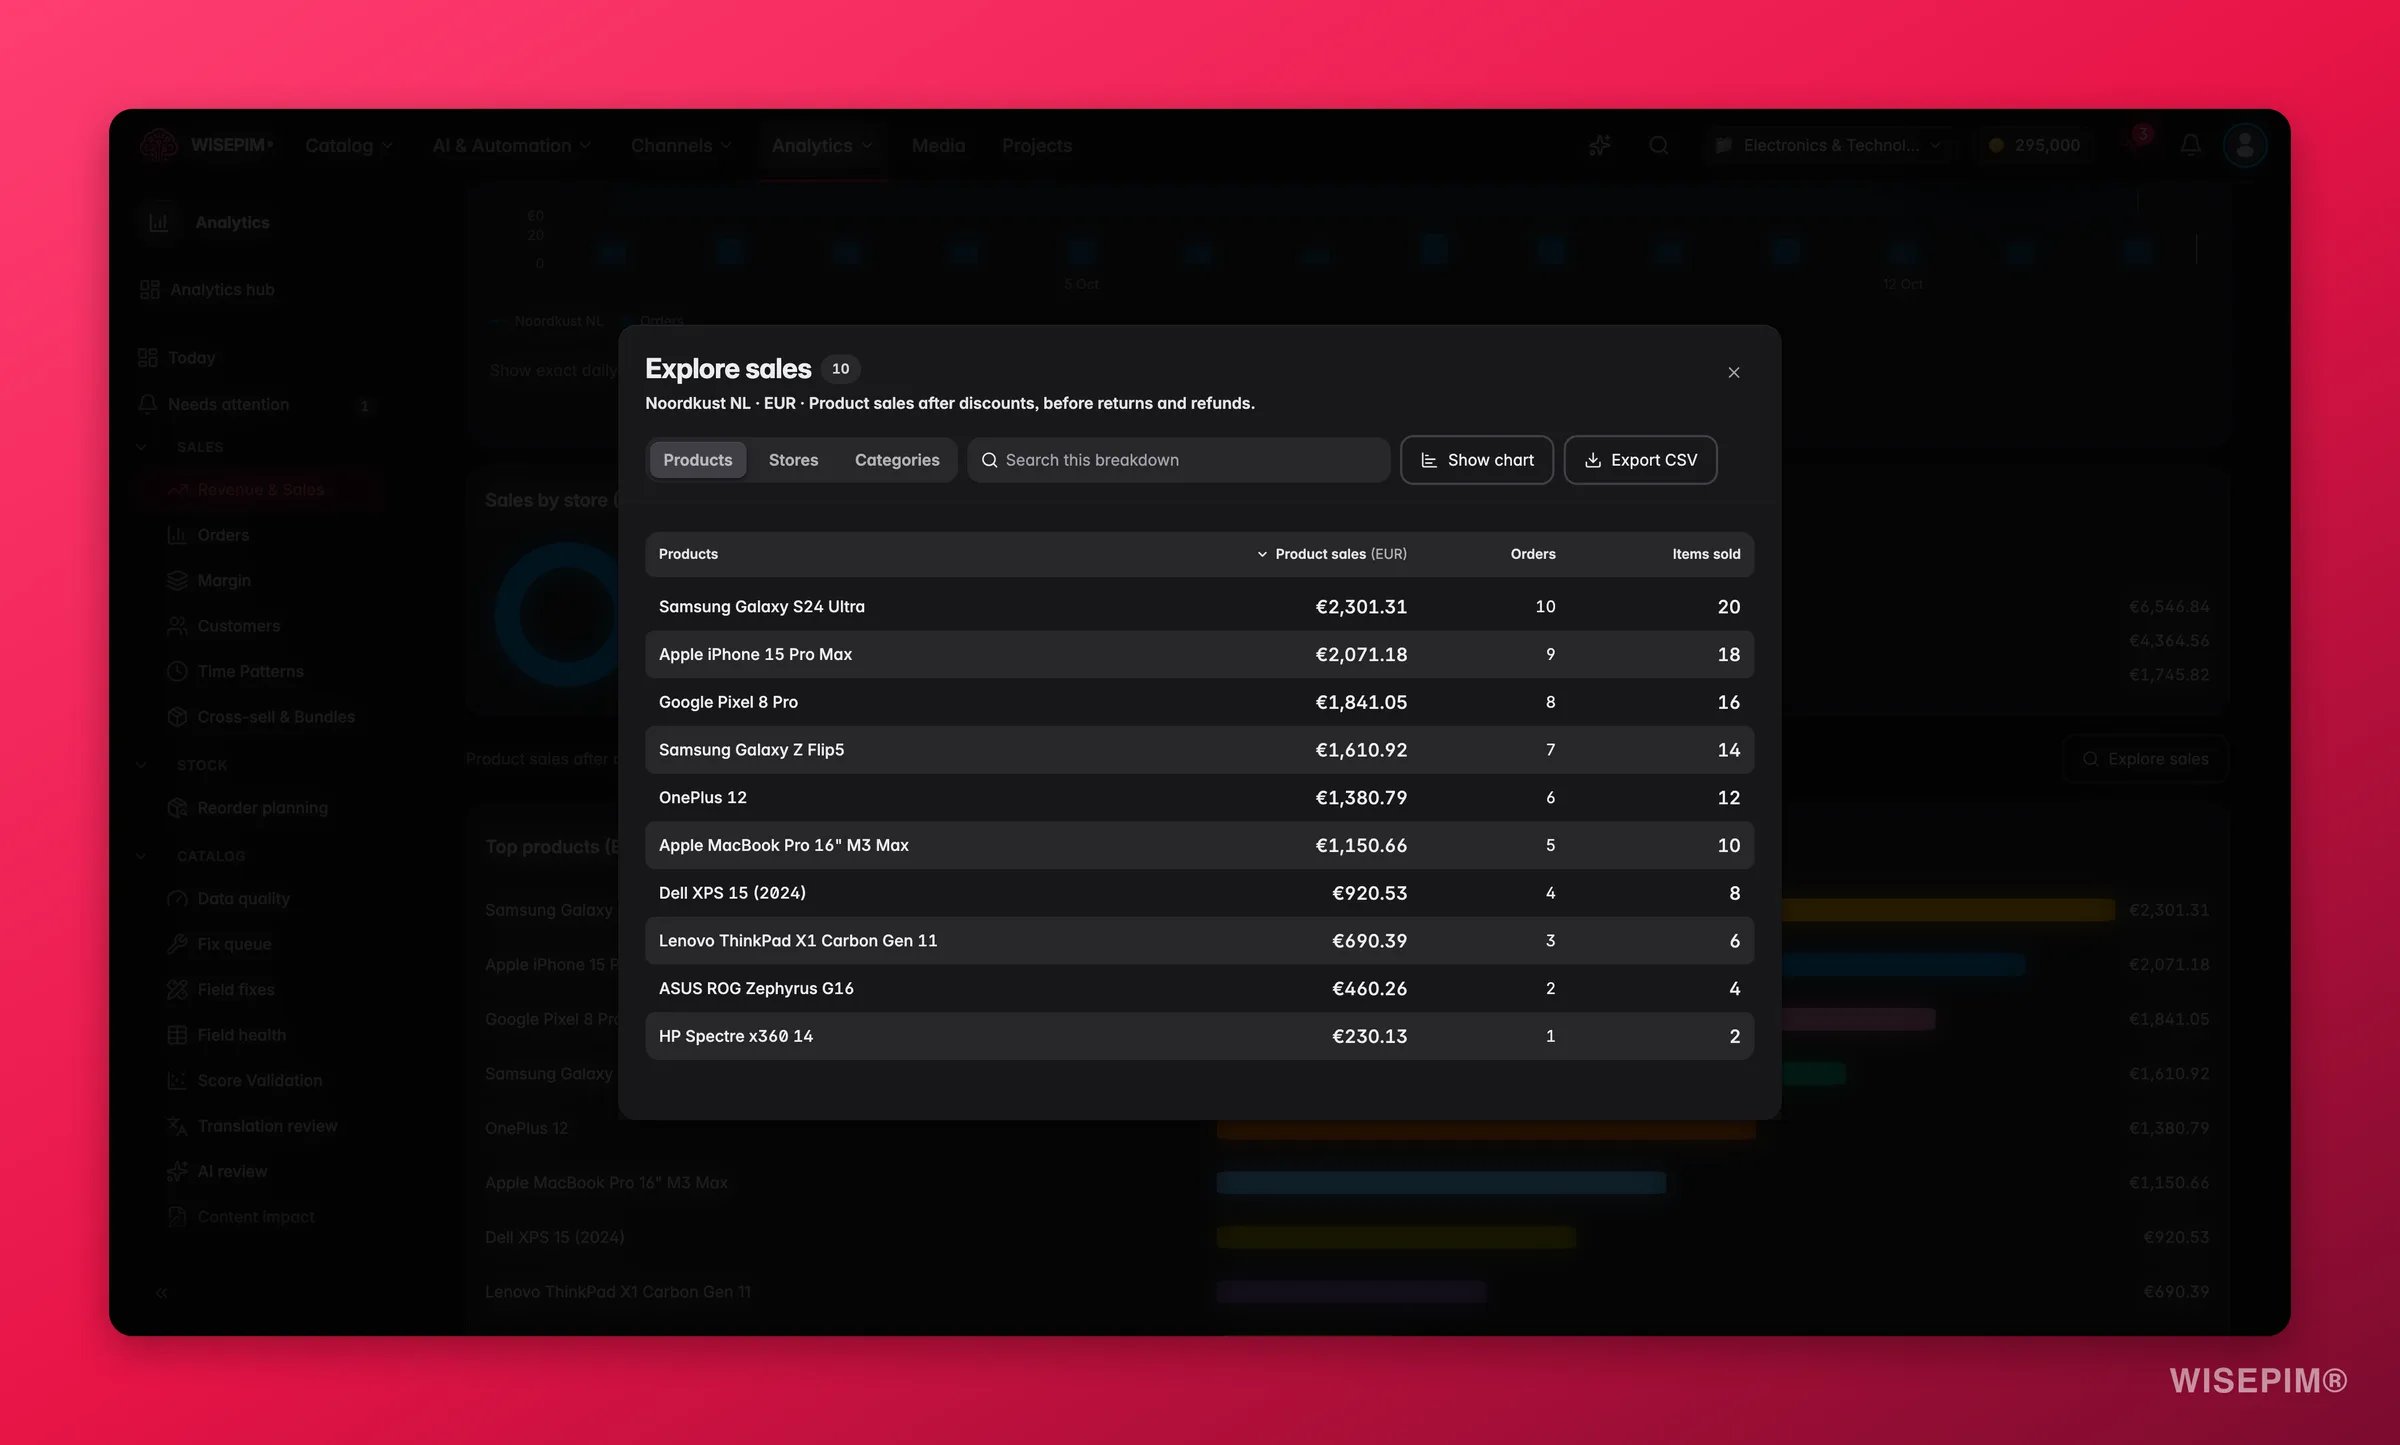
- Breakdown switches between Products, Stores and Categories.
- Search this breakdown narrows the rows by name or SKU.
- Show chart draws the Top 12 matching results; Hide chart puts the table back.
- Export CSV downloads the rows with exact values.
The explorer never adds stores with different currencies together. Pick a store and currency in the scope bar first; for a total across stores in one reporting currency, use the reporting card on the Orders page.
Act on what you find
Totals are flat while orders are up
Totals are flat while orders are up
Baskets are getting smaller. Open Explore sales on Products and sort by sales: if cheaper products took over the top, that is the cause. Open Orders and the Promotions view to check whether a discount code is doing it.
One store carries most of the sales
One store carries most of the sales
Compare stores under Sales by store, then open the By store tab on Orders for each store’s own trend. Stores that convert worse usually have thinner content; run enrichment on their best-selling categories first.
A category is falling
A category is falling
Open Explore sales on Categories, then switch to Products and search that category’s products to find which ones dropped. Check Reorder planning before you blame content: an out-of-stock best seller explains most category drops.
The pace tile says history is needed
The pace tile says history is needed
A day in the period has no confirmed import, so the projection is withheld rather than guessed. Open Data health and check History in this period for the store.
Unmatched products is not empty
Unmatched products is not empty
Those lines count in order totals but not in product or category sales. Link them under Unmatched products, then run Update reports under Analytics settings.
Related
Orders
Every order by store, with Most sold, Least sold and By store tabs.
Margin
What you keep after product, selling and marketing costs.
Category Insights
Sales, orders and quality at the category level.
Time Patterns
Busiest hours, weekdays and months from the same orders.