

Customers are counted from the orders we imported, per store. Someone who bought before your first import may show up as new. bol buyers are anonymous, so they are not counted.
Repeat customers
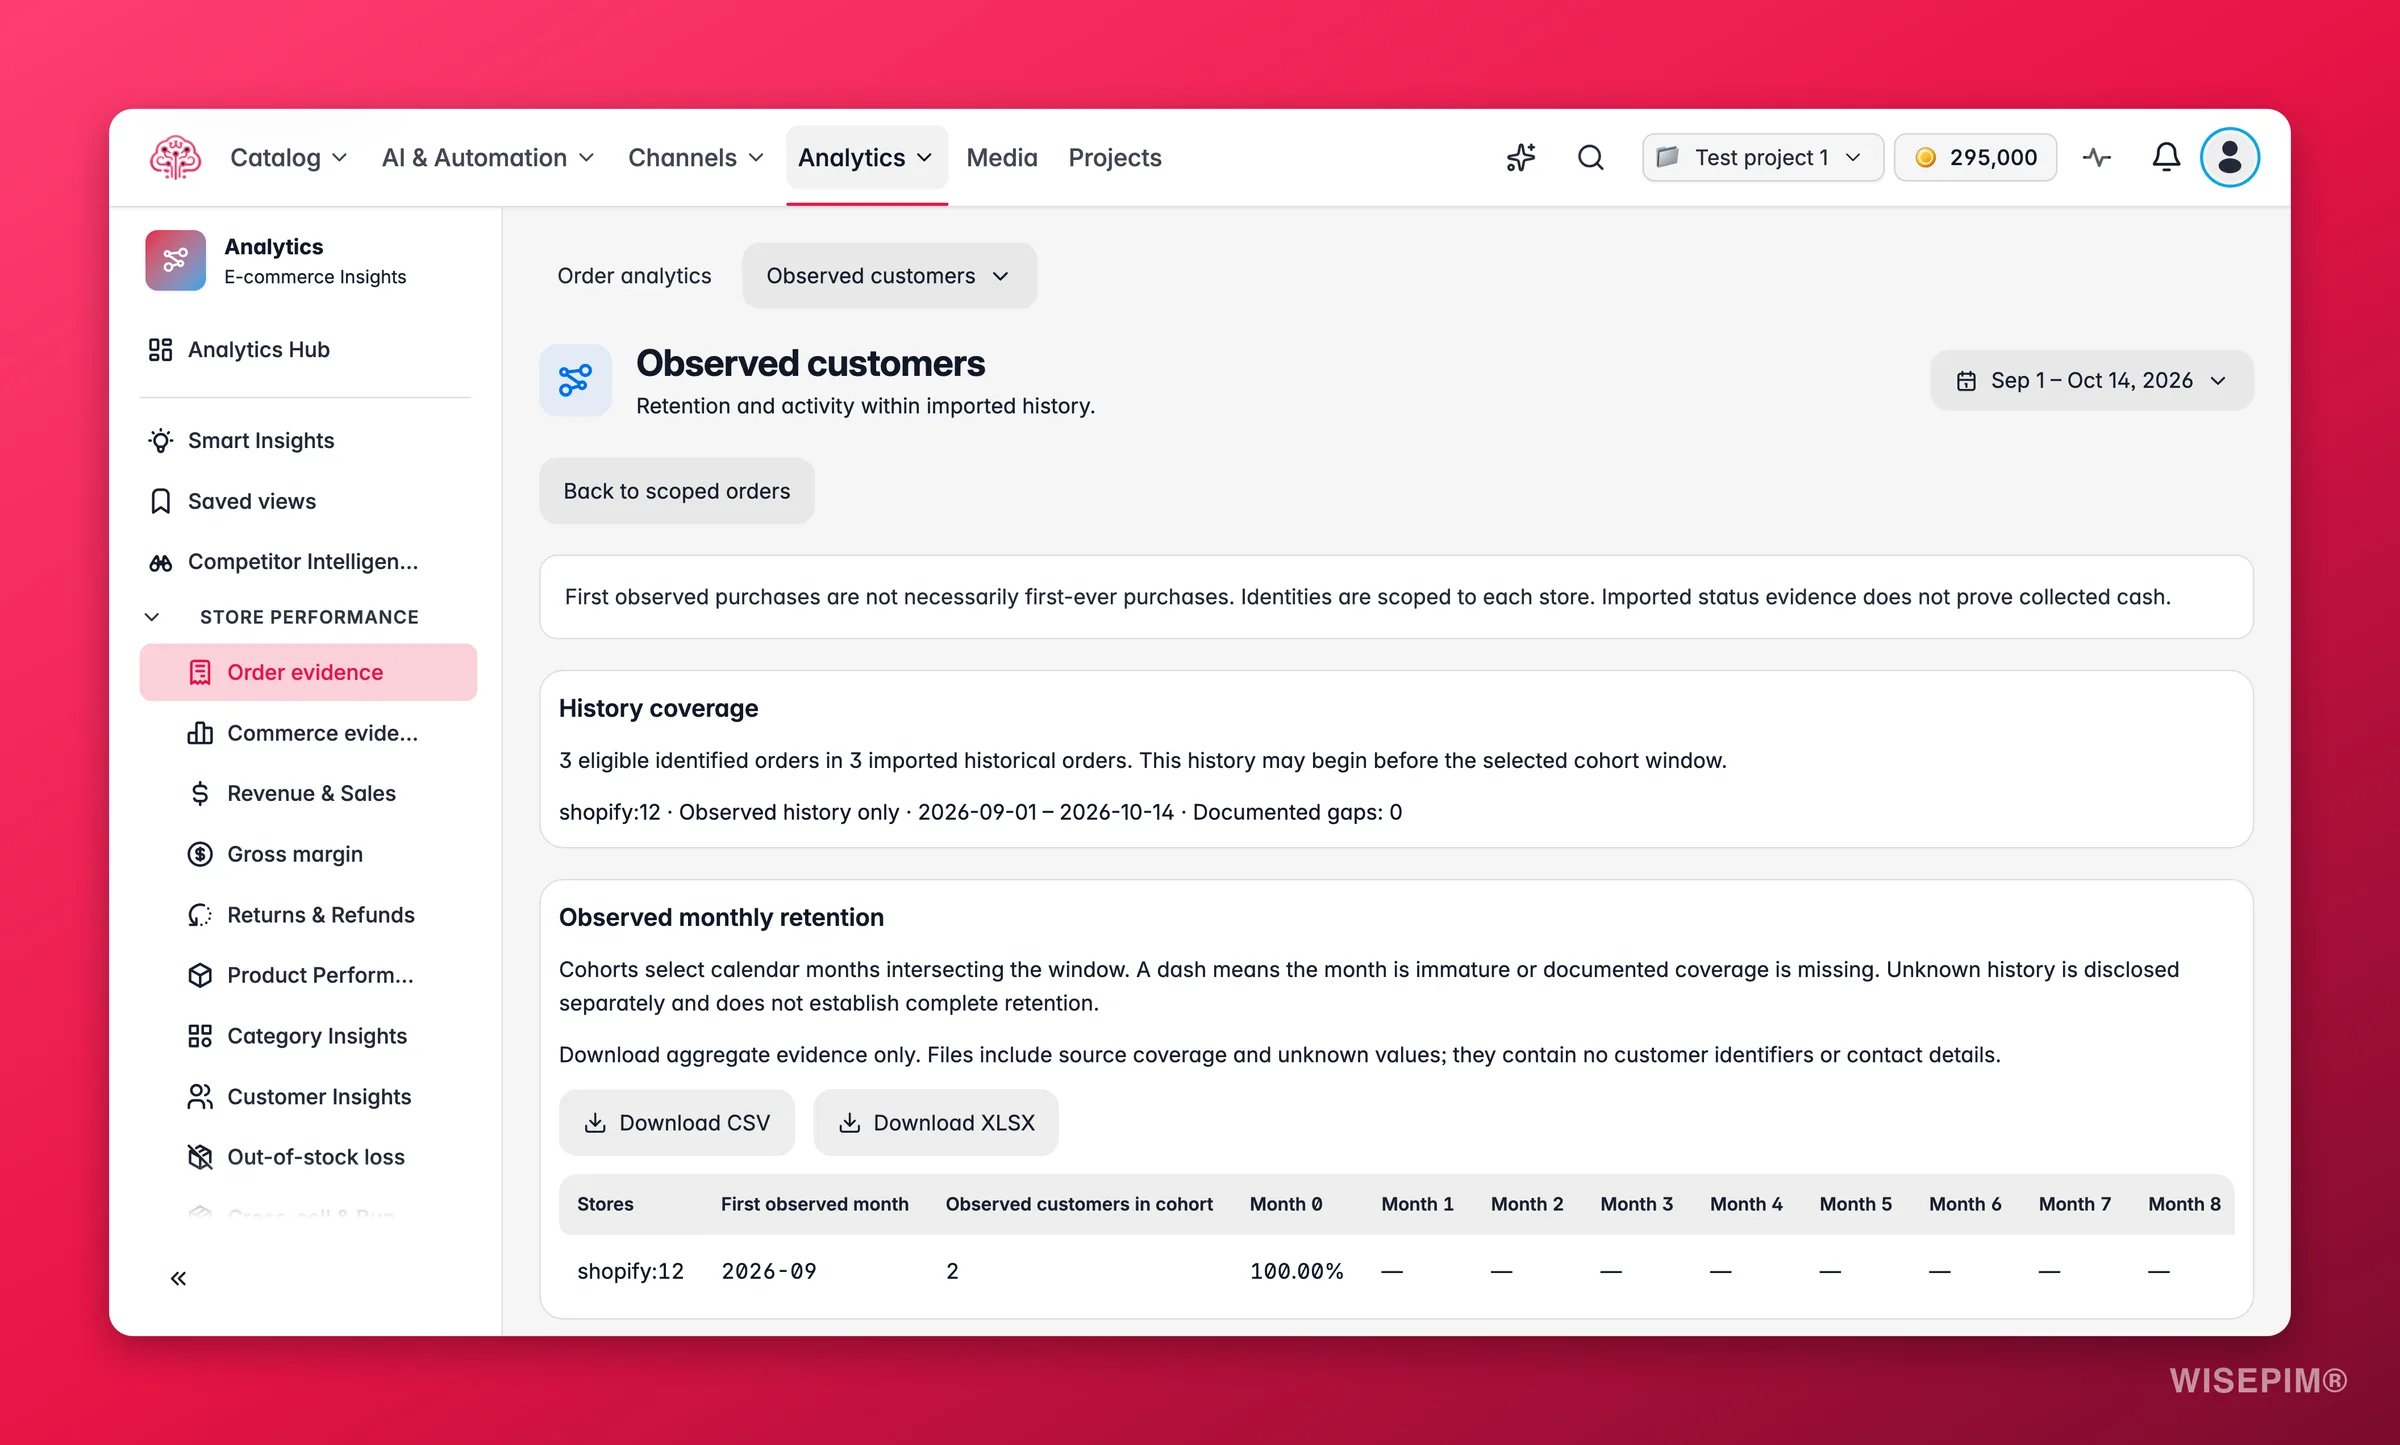
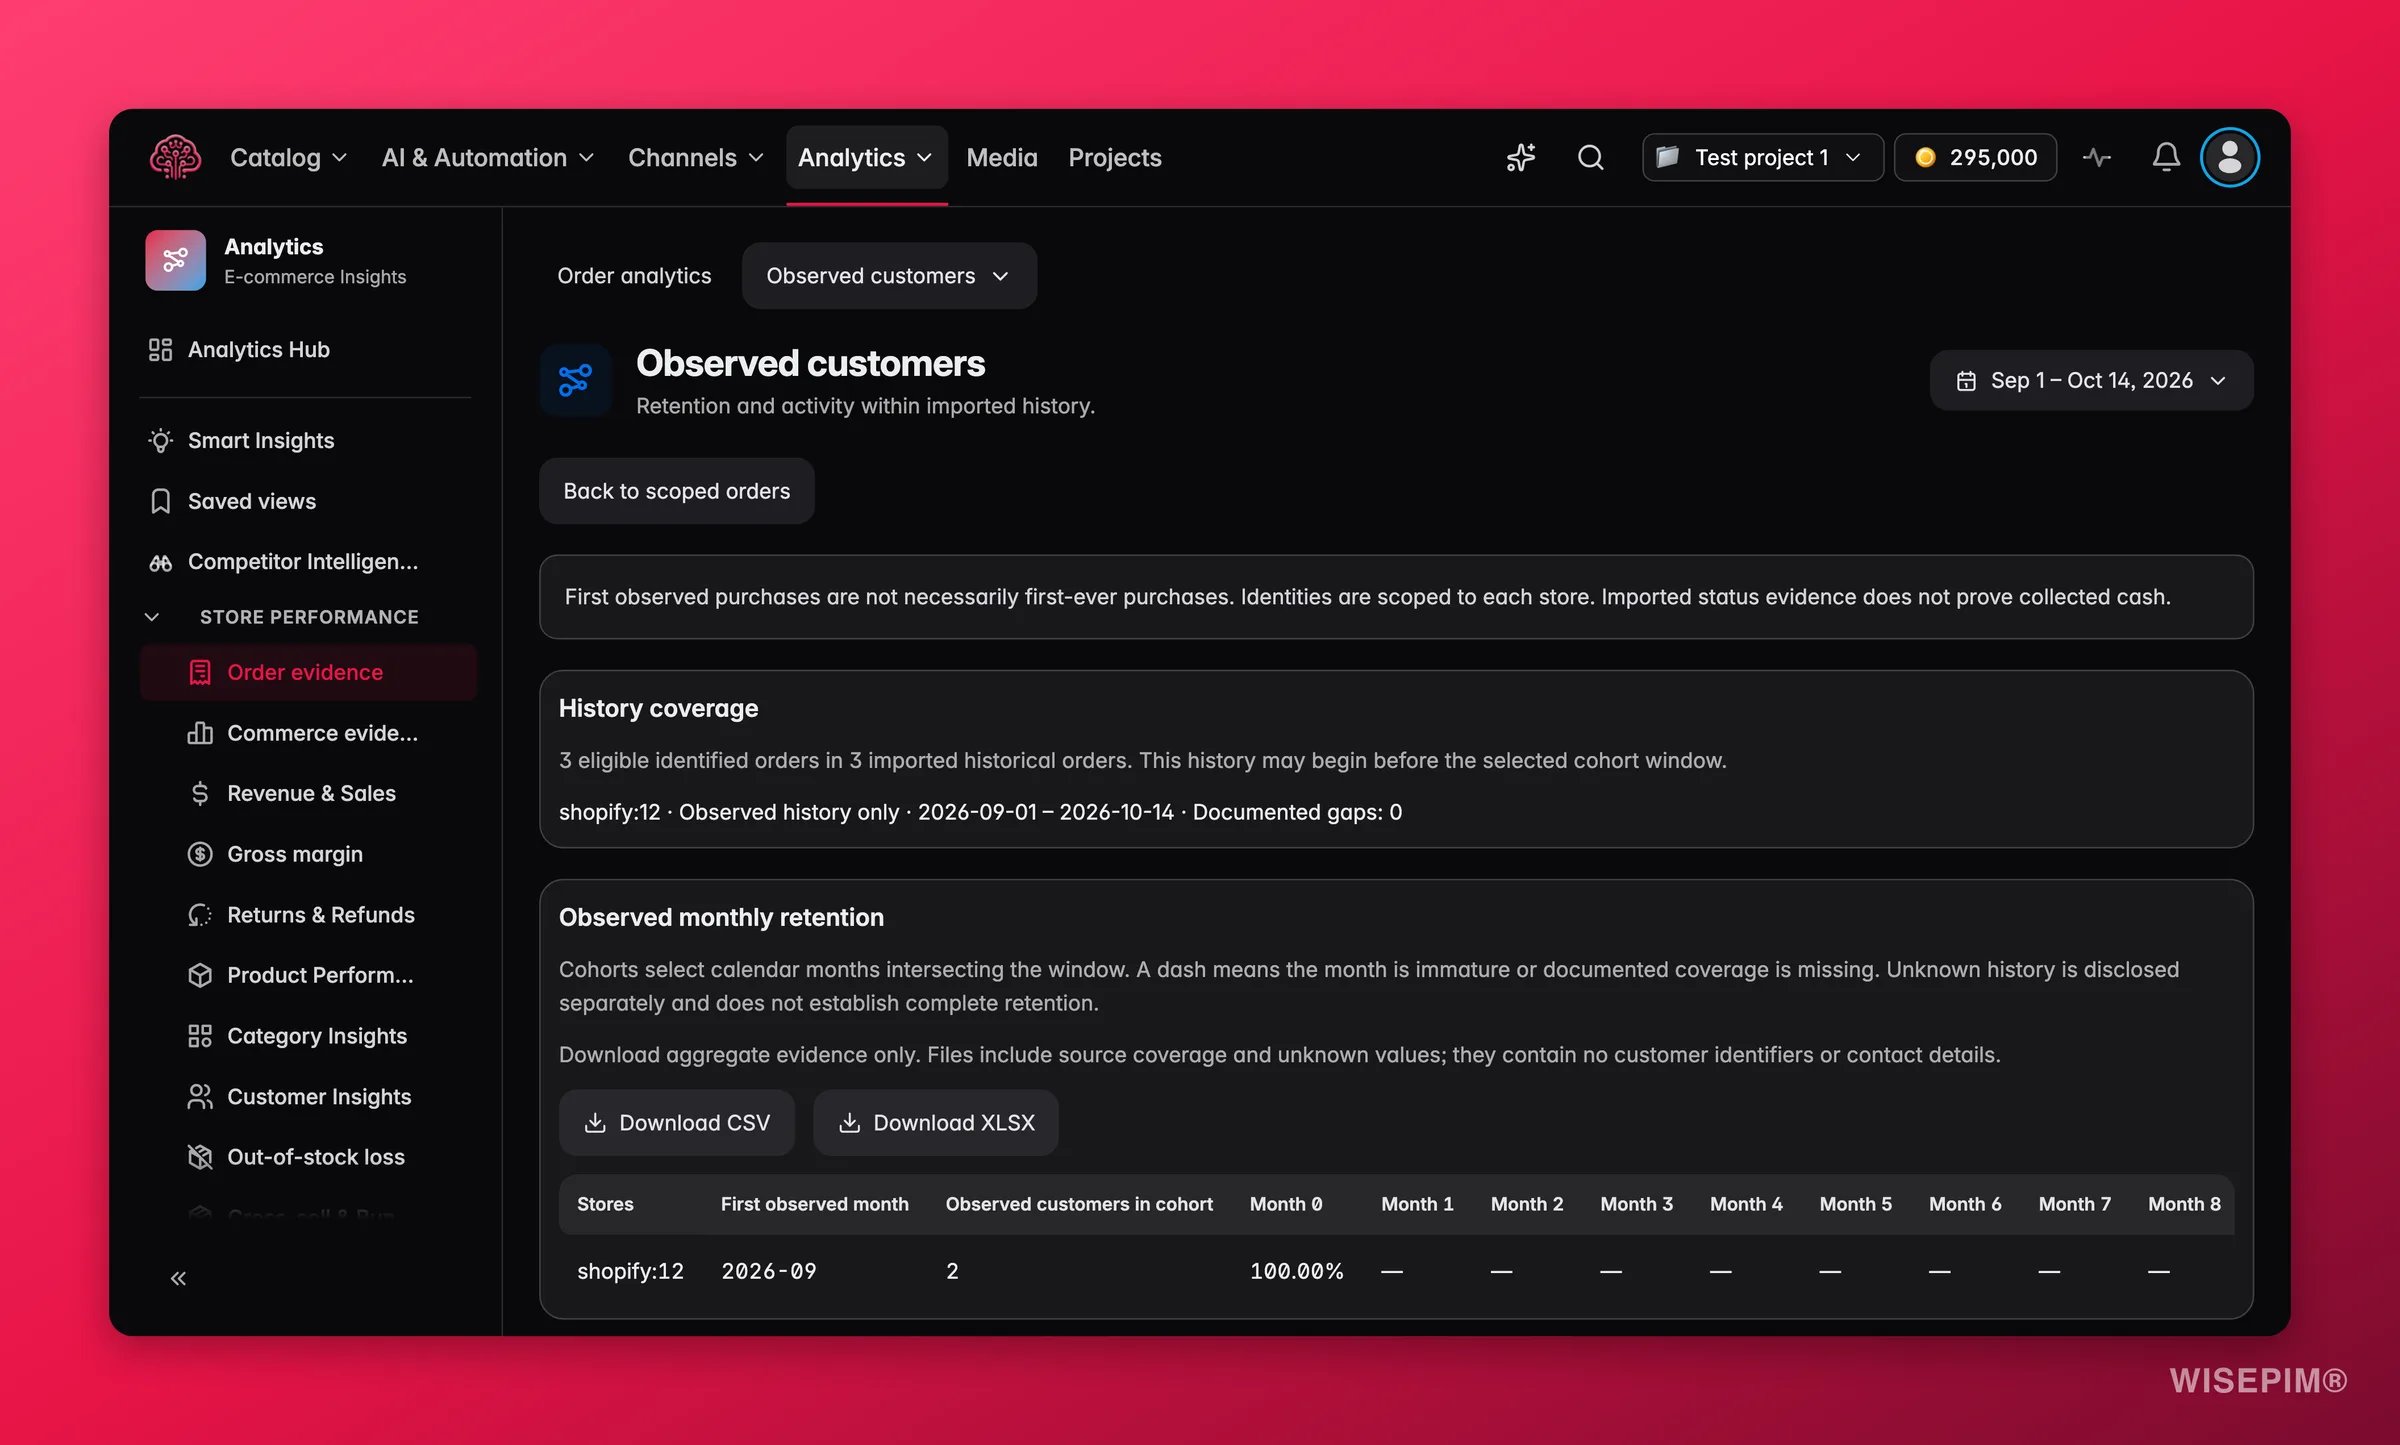
Customers who ordered again, by month since first order
The heatmap has one row per First order month, a New customers column and then Month 1, Month 2 and so on. Each cell is the share of that cohort that ordered again in that month. “A dash means the month isn’t over yet or our order history has a gap.” Download CSV and Download XLSX export the table. “Downloads hold totals only, with no customer names or contact details.”Customer value by month since first order
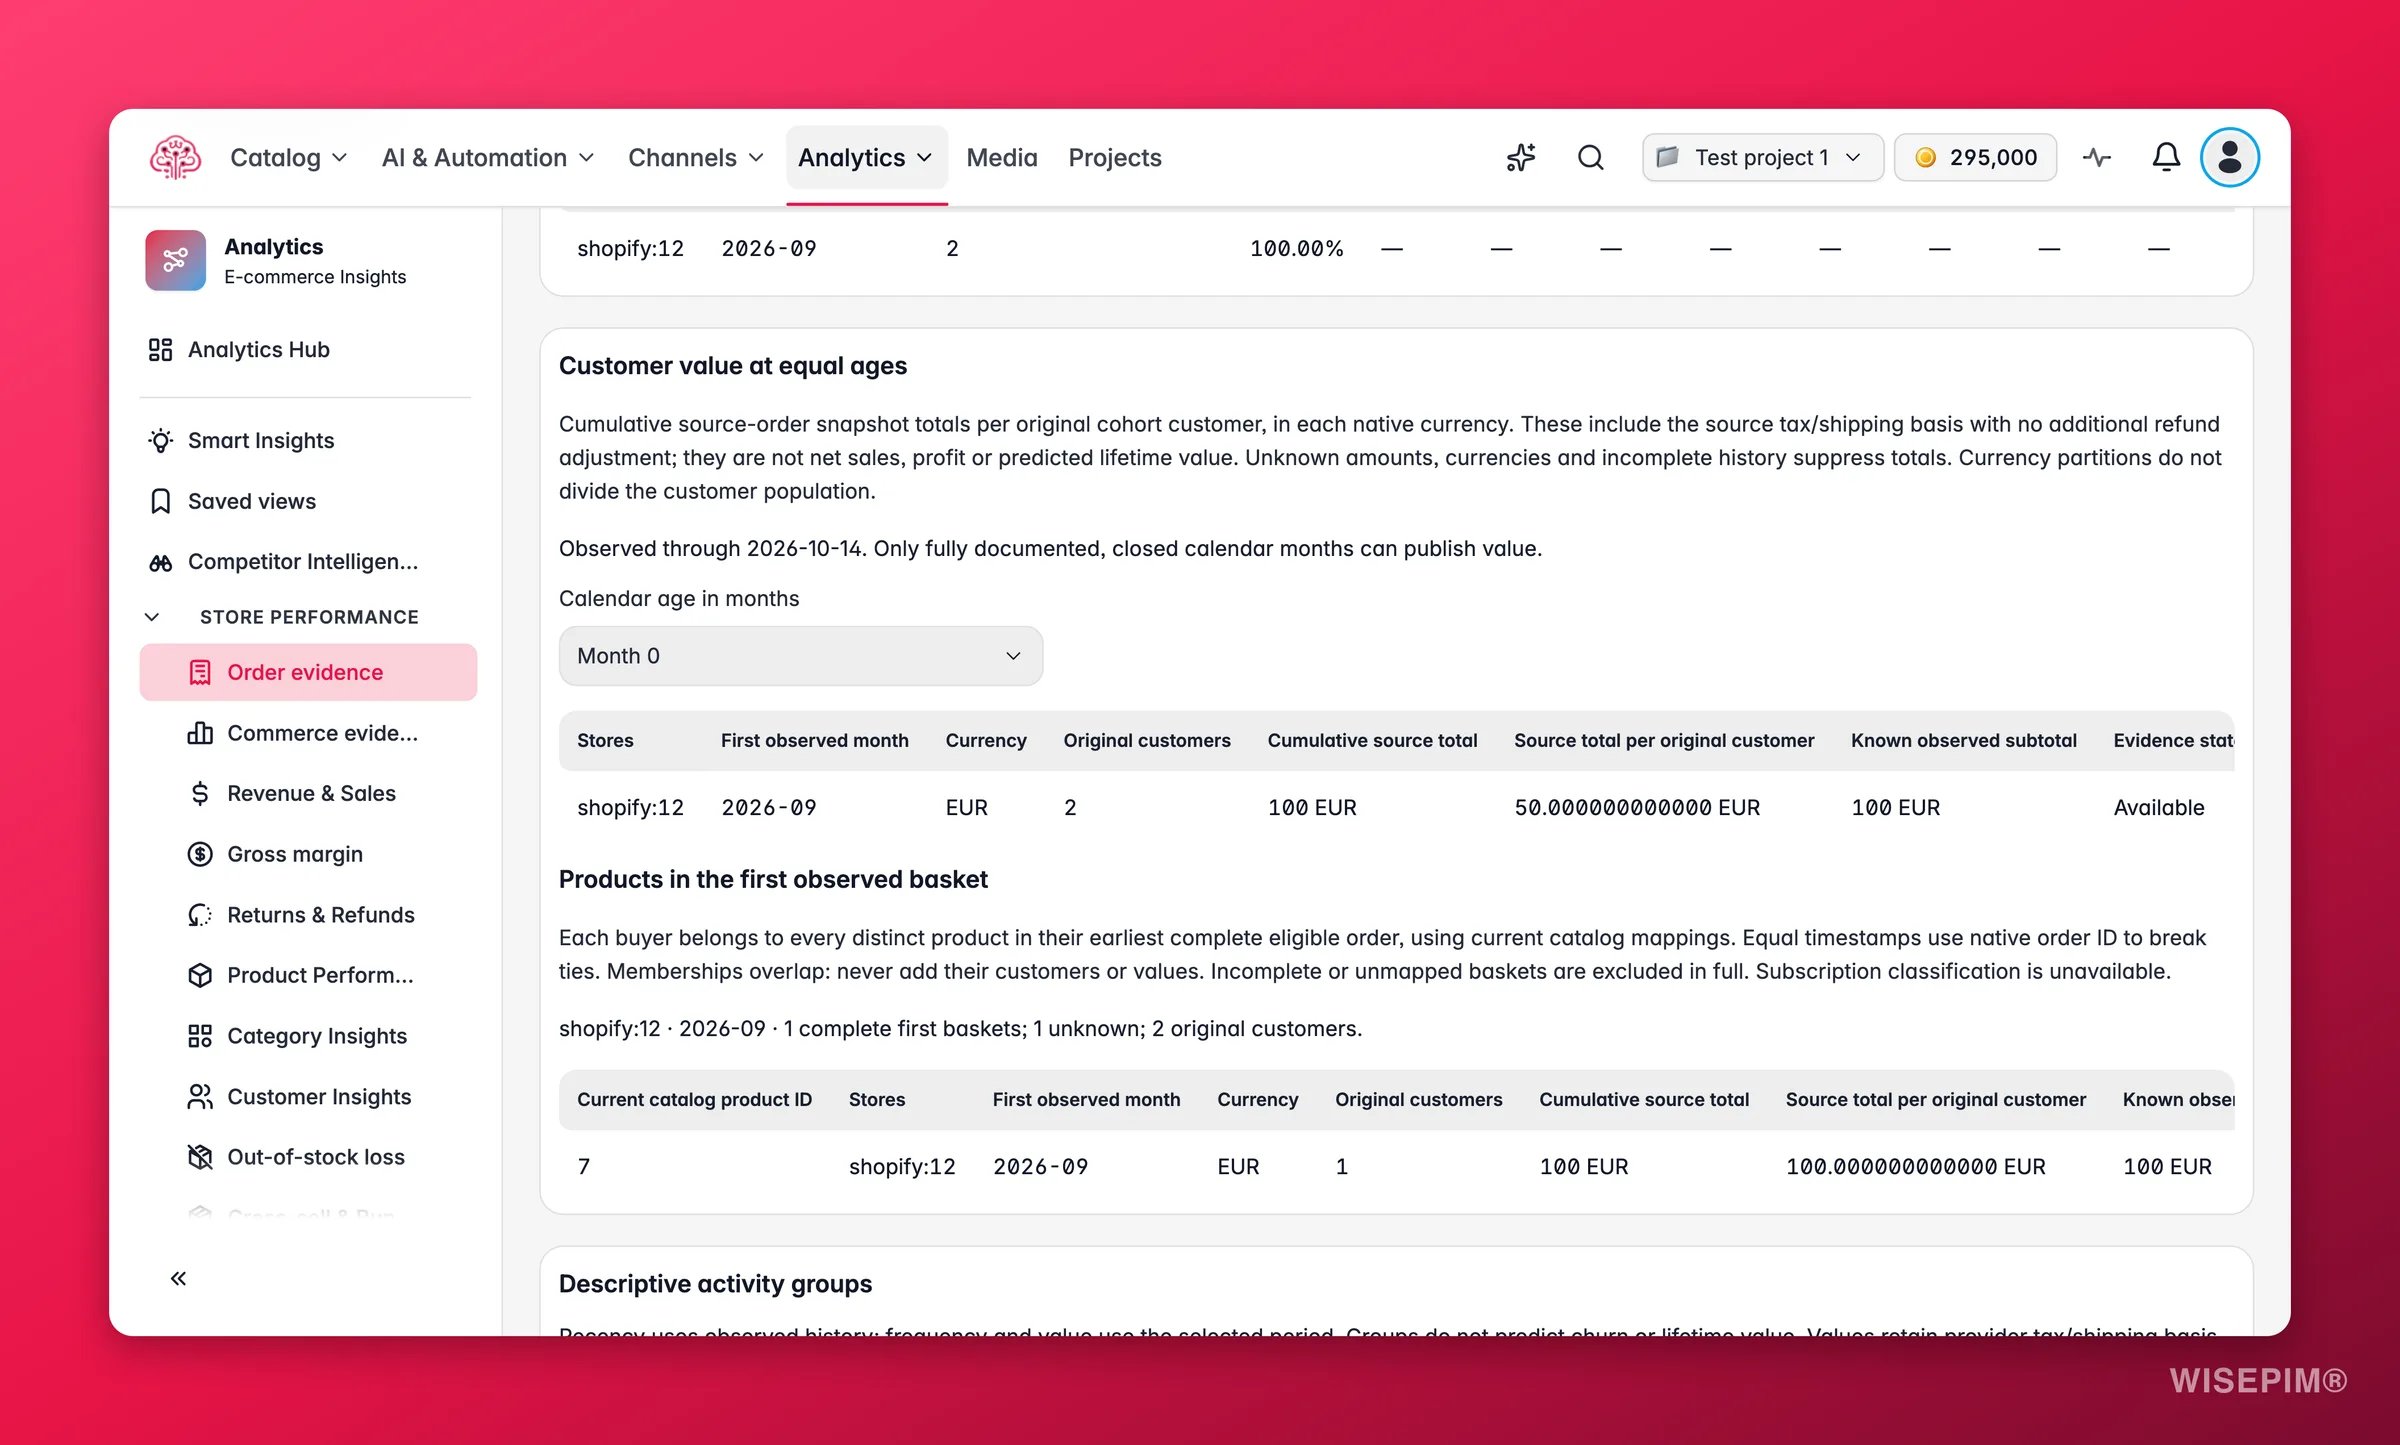
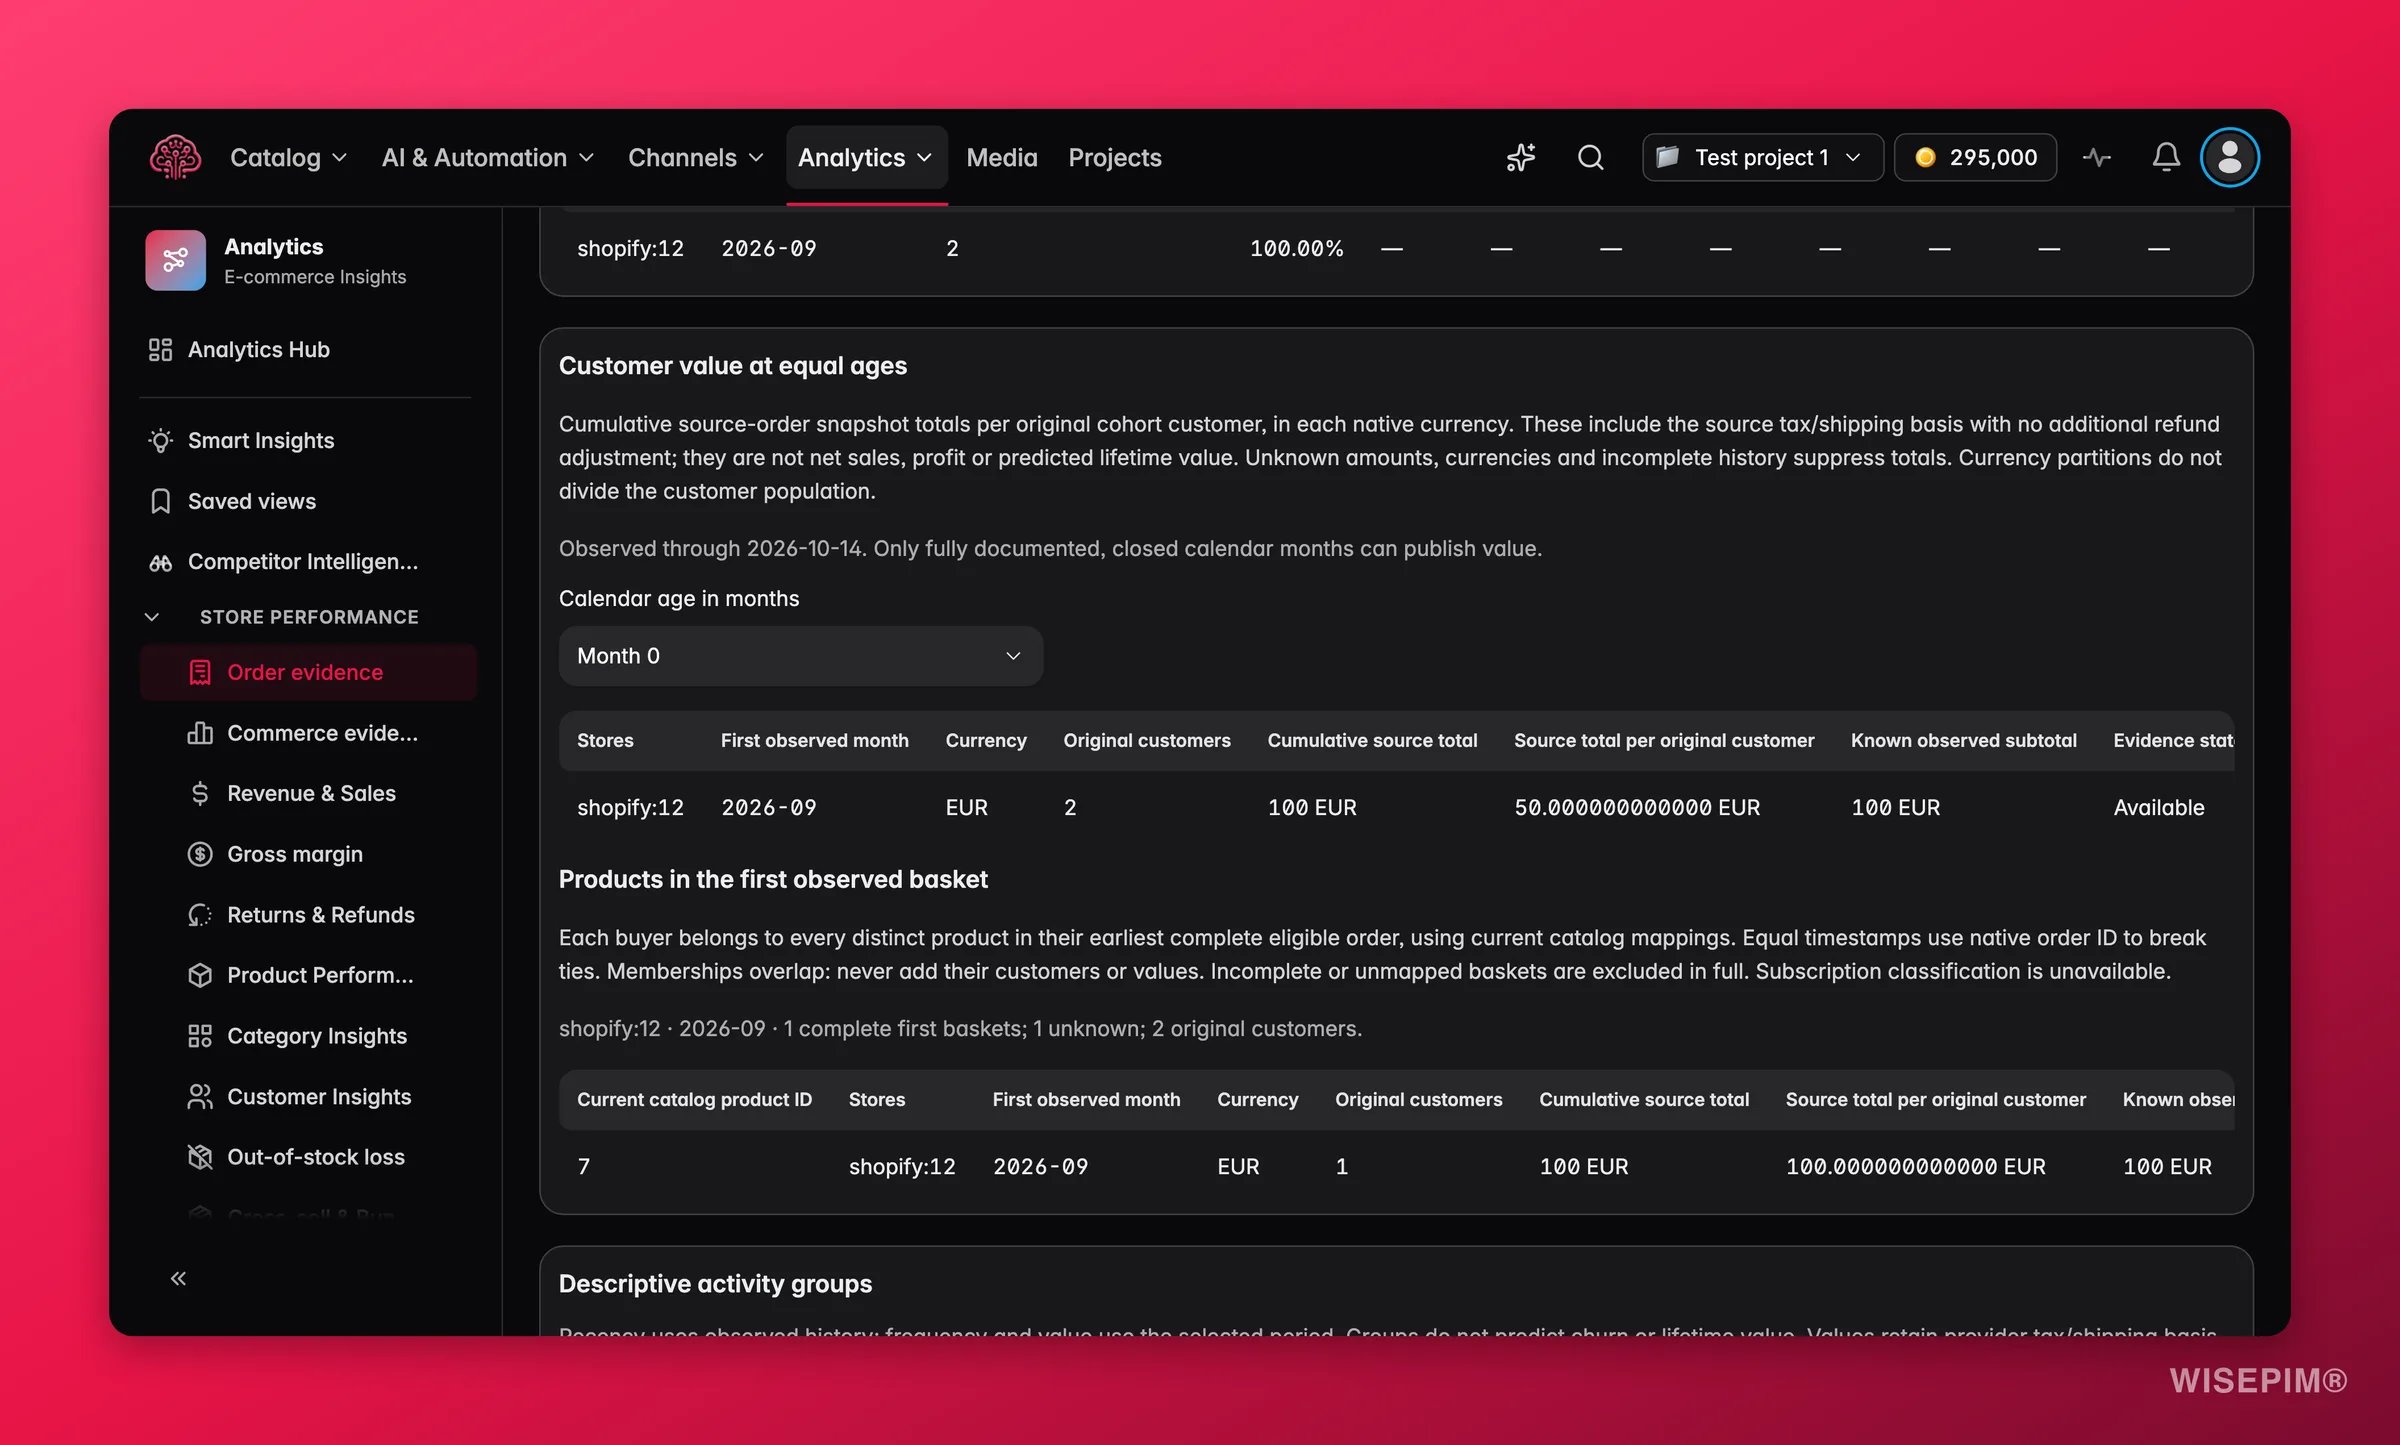
Values are compared at the same age. A cohort that started in March is compared with a cohort that started in June at month 3 for both, so a young cohort never looks worse only because it is younger.
Products in the first order
This list ranks the products that appear in customers’ first orders. The rule on the page: “Customers count under every product in their first complete order, so one customer can appear under several products. The rows overlap, so they don’t add up to a total.” The footer counts coverage: 412 complete first orders, 38 unknown, 450 customers.Customer groups
Groups sort customers by how recently, how often and how much they ordered: Recent repeat buyers, Recent buyers, Less recent buyers, Other buyers and No orders in this period. “Each store counts its own customers, so totals across stores would count some people twice.”Act on what you find
Repeat rate is low
Repeat rate is low
Check the Order history state first. History since your first import means early repeat buyers look new, which pulls the rate down. If history is full, look at Products in the first order: products that rarely lead to a second order are candidates for a follow-up offer or for pairing with a product that does, using Cross-sell & Bundles.
A cohort's value stops growing after month 2
A cohort's value stops growing after month 2
That is the moment customers stop coming back. Compare the heatmap row with the Returns view in Orders for the same months. A refund spike in month 1 or 2 often precedes the drop, and the refund reasons tell you whether product content is the cause.
Totals across stores look too high
Totals across stores look too high
They are not meant to be added. Each store counts its own customers, so someone who bought in two stores is counted twice. Read the groups and cohorts per store.
The page says there are too many customers
The page says there are too many customers
Too many customers to analyse at once. Pick fewer stores or fewer months. The value table is calculated per customer and month, so narrow the selection.
Related
Orders
The orders these customers are counted from, by store.
Cross-sell & Bundles
Pair first-order products with the ones that bring people back.
Time Patterns
When your customers order, by hour, weekday and month.
How Order Numbers Work
Equal-age cohorts, first-basket overlap and history coverage, explained.