

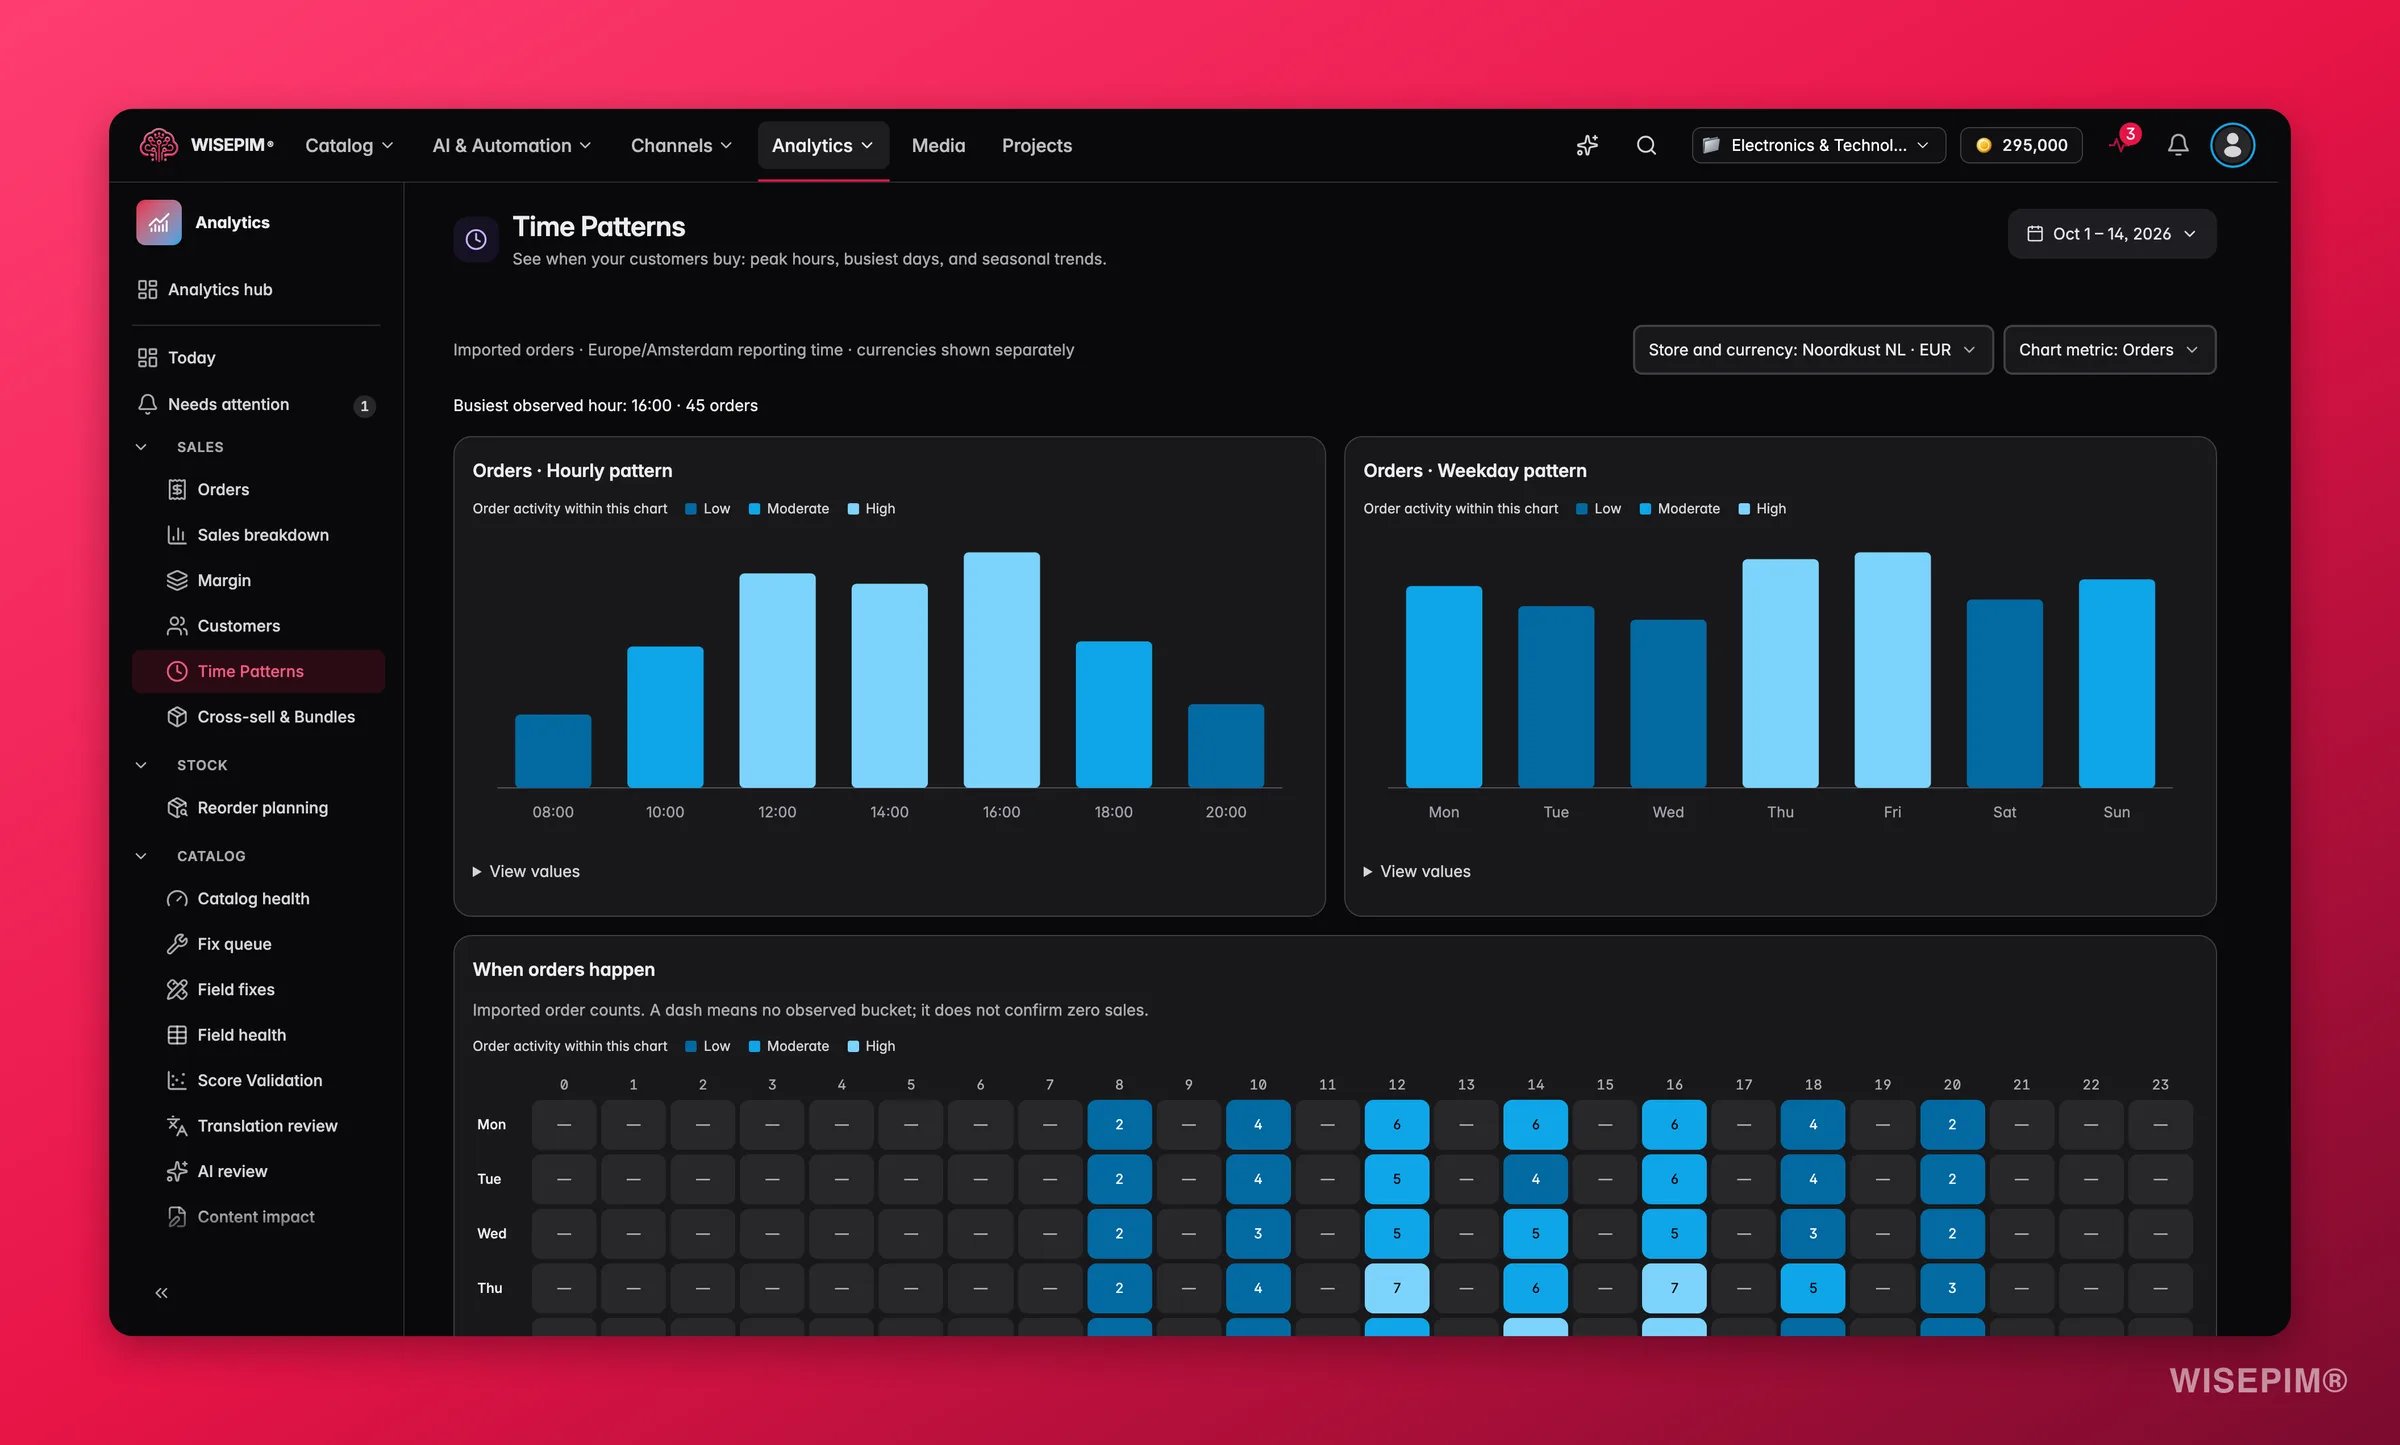
Every number on this page is an observed count from imported orders. The basis line under the title reads Imported orders ·
{timezone} reporting time · currencies shown separately. Nothing is forecast or estimated, and a missing bucket is shown as a dash, not a zero.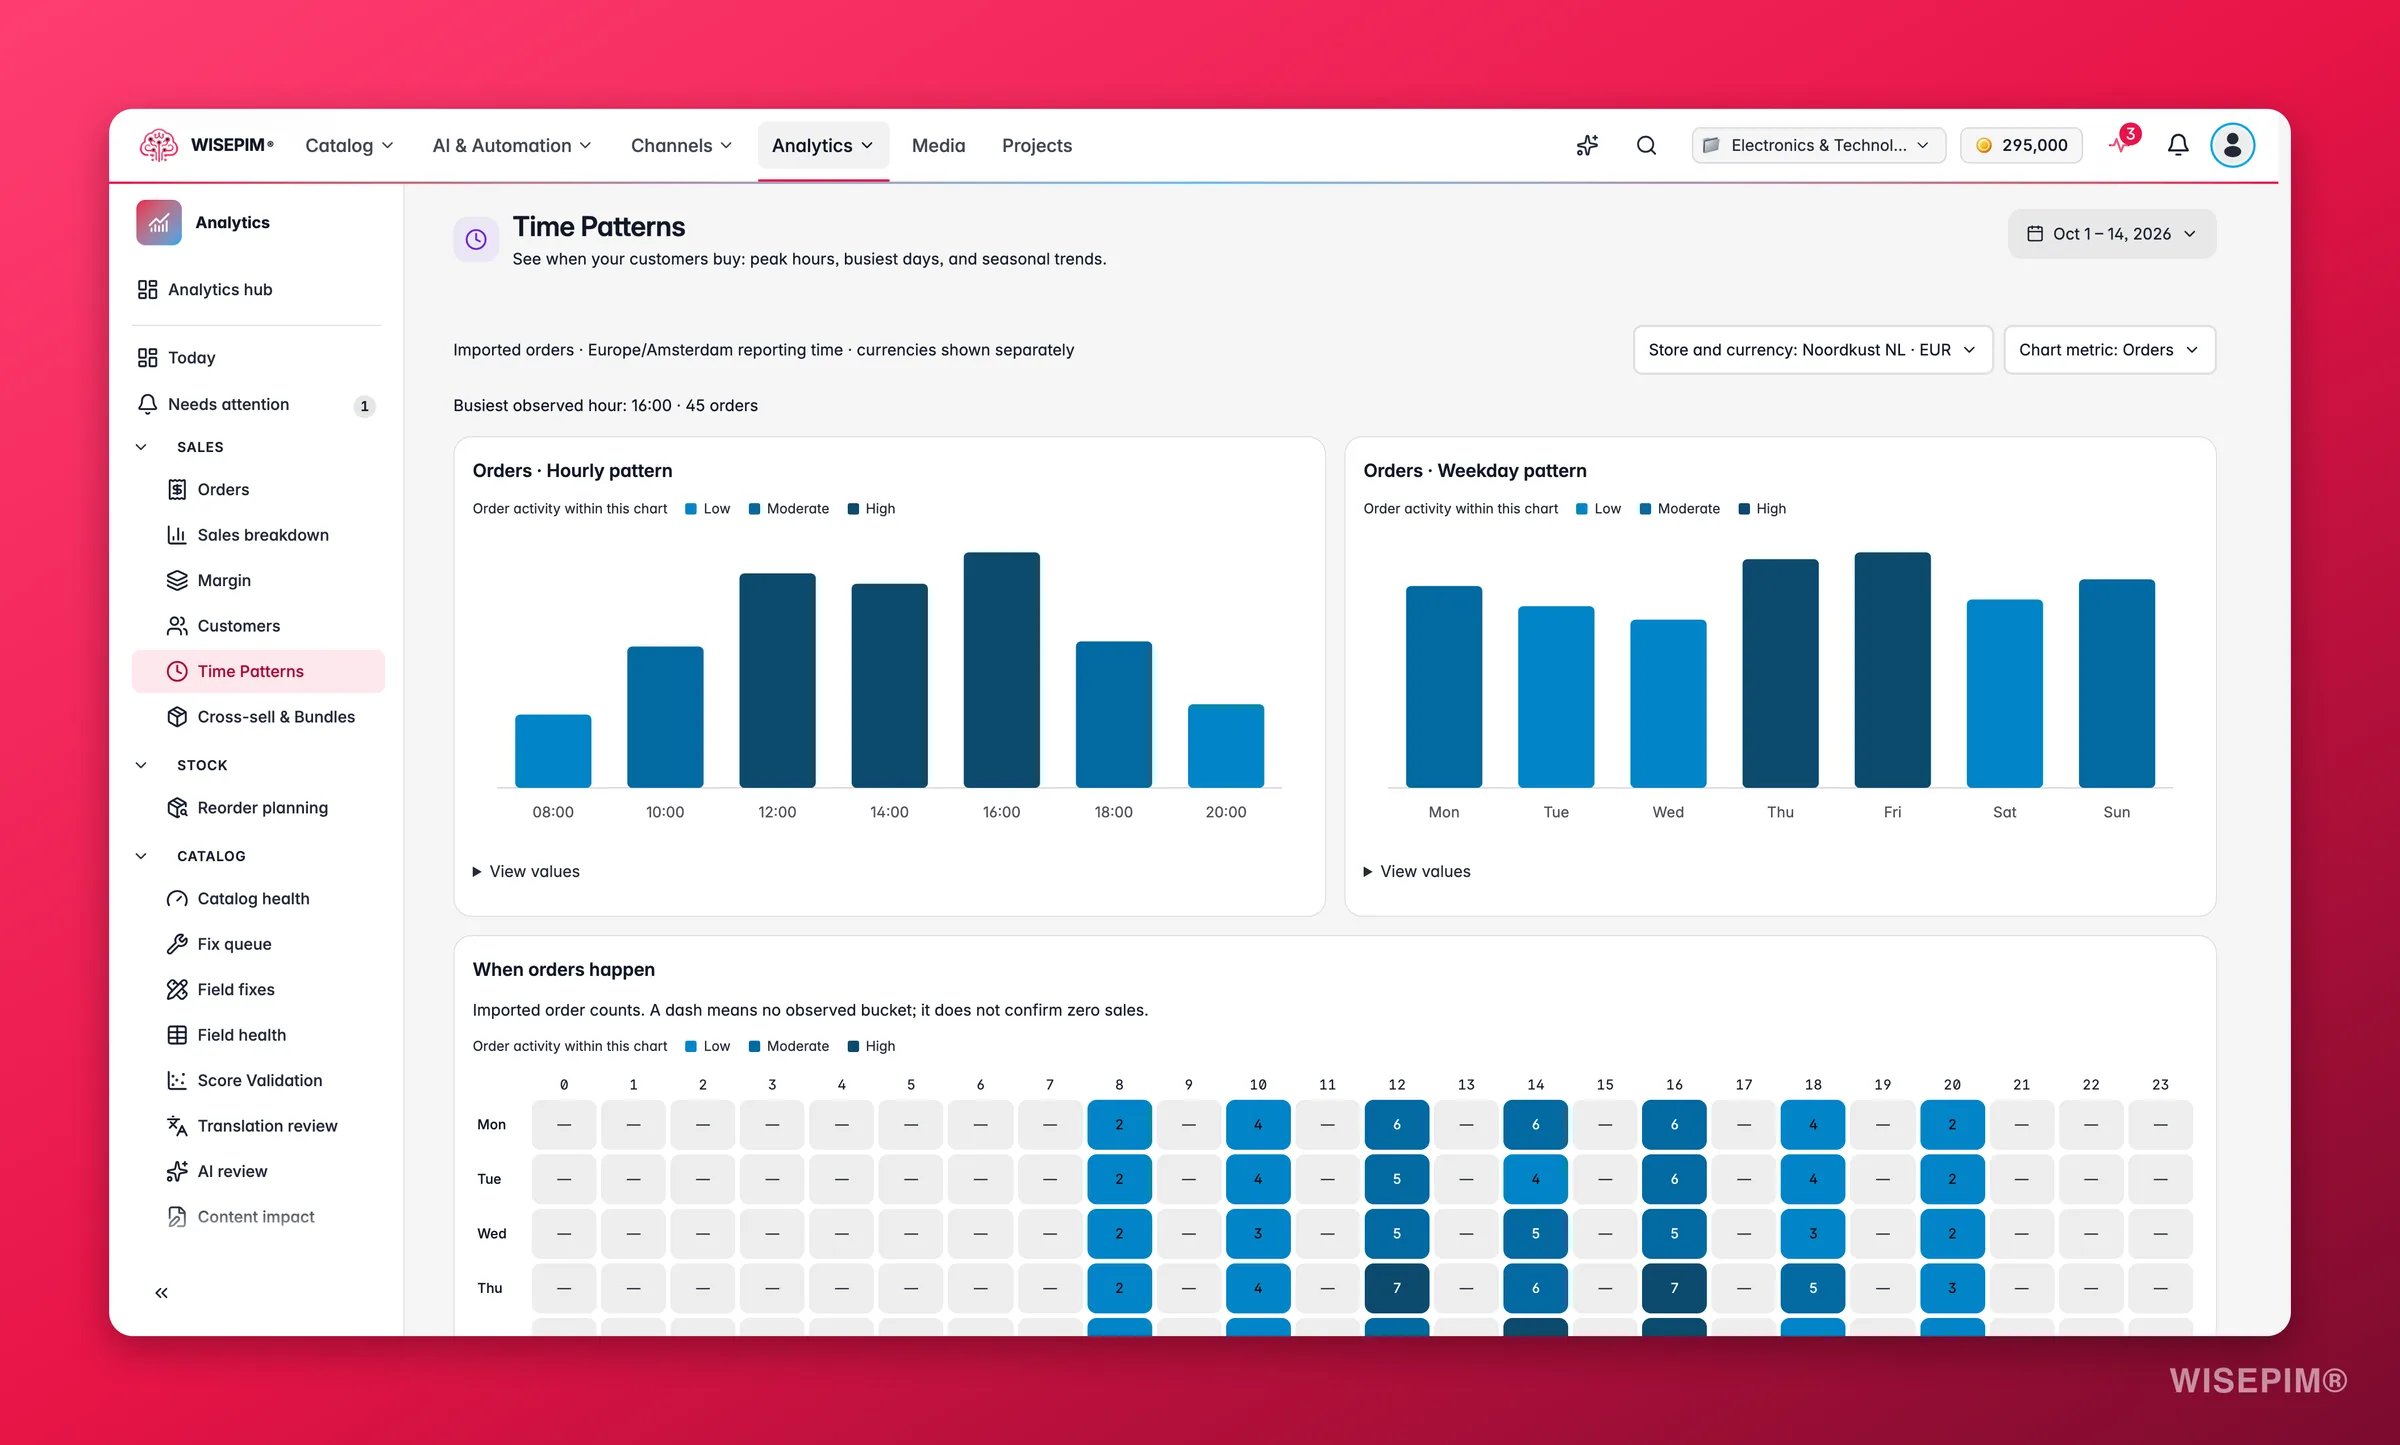
Pick a store and a metric
Two controls sit above the charts:
Use the date picker in the page header to set the period. The page reads up to 366 days; a longer range is refused with a prompt to pick a shorter one.
Imported order totals include the amounts supplied by each store. They are not net revenue or collected payments, and an order whose amounts the platform did not send stays unknown rather than counting as zero. Stores that send order lines without amounts, such as bol, only contribute to Orders.
Read the charts
A single line above the charts names the peak: Busiest observed hour:{hour} · {count} orders. It is the hour with the most orders in the selected store and period, nothing more.
The chart titles switch with the metric, so you read Orders · Hourly pattern or Imported order total · Hourly pattern and always know which number you are looking at.
When the period holds no orders for the selected store, the page says No time pattern data for this period yet. Try adjusting the date range, or sync more orders to reveal when customers buy.
Act on what you find
One hour clearly leads the hourly pattern
One hour clearly leads the hourly pattern
Schedule email campaigns and social posts to land 30 to 60 minutes before the busiest observed hour, and make sure feed exports and price syncs finish before it. Set a recurring schedule in Automations that completes ahead of the peak. Outcome: campaigns reach shoppers when they are already buying, and feed errors never surface in your busiest window.
A stretch of hours shows no orders at all
A stretch of hours shows no orders at all
That is your maintenance window. Queue bulk enrichment, imports and image processing from Managing Your Products to run in those hours so they never compete with live traffic. Outcome: heavy jobs finish faster and shoppers never notice them.
Weekdays and weekends differ sharply in the weekday pattern
Weekdays and weekends differ sharply in the weekday pattern
When weekdays carry the orders, use weekends for content updates and re-enrichment. When weekends lead, get content and feeds ready before Friday and avoid big changes until Monday. Outcome: changes land when the fewest customers are affected.
Two stores peak at different hours
Two stores peak at different hours
Switch Store and currency between them and compare the hourly patterns. Stores in different markets often sit hours apart. Schedule per-store campaigns and syncs separately instead of one global slot. Outcome: each store gets its own timing rather than a compromise that fits neither.
The monthly pattern shows a month falling behind
The monthly pattern shows a month falling behind
Open Revenue & Sales for the same store and period to see which products and categories dropped, then check Orders for the week-over-week movers. Outcome: you know whether the dip is seasonal or a product problem before the next month closes.
Related
Revenue & Sales
Sales per day, by store and by category, from the same imported orders.
Orders
Every imported order, with movers, baskets, returns and promotions.
Cross-sell & Bundles
Which products land in the same basket, per store.
Traffic & Behavior
Compare when visitors arrive with when orders happen.